- Homepage
- About the Joint Centre
- Research Areas & Projects
- Researchers
- News & Events
- Open Positions


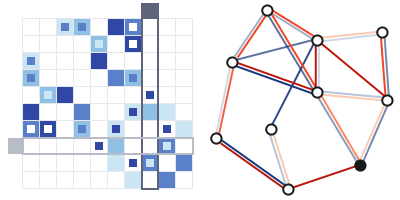
Networks are used to model a wide range of phenomena, from computer networks to similarities between genes, brain activity, and social interactions between individuals (social networks) or organizations. Yet, making sense of these complex networks requires more than modeling and statistics. Network visualization has progressed dramatically in recent years and provides novel and effective ways to make sense of complex networks through effective visual encodings and interactions. With the advent of novel display technologies and interaction techniques, network visualization has potentials to become even more effective.
Many scientific domains are thus now convinced that network visualization is essential to improve their work since it allows them to see complex structures that statistics and modeling alone cannot reveal. From the perspective of network visualization, there are lots of commonalities in the wide range of issues raised by the different scientific domains, as well as some very specific issues too.
In the recent years, The Microsoft Research Redmond VIBEVis working group and INRIA AVIZ project team have shown that their techniques were extremely effective to visualize social networks as well as brain connectivity data.
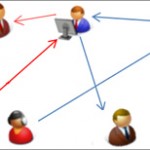
Social networks have become popular in recent years with platforms such as Facebook and LinkedIn, but they are also used to study collaboration between people and organizations. VIBEVis and AVIZ have developed a wide arsenal of techniques to facilitate the exploration of such data, to support its understanding, and to enable the presentation to a large audience for decision making or communication purposes.
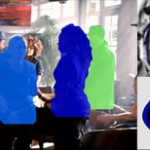
Brain connectivity visualization is an enabling tool for understanding how the brain works in the long range, but is also important in the short term to convey important information to neuroscientists and brain surgeon about interactions in the brain related to studies or surgery.
In this project VIBEVis and AVIZ want to further explore the generic issues raised by network visualization and the more specific ones for the domains of social network visualization and brain connectivity visualization as two major application domains for this field of work.
The main scientific challenges are:
Find more information on our project website: www.visualizingbrainconnectivity.org

2017
Article dans une revue


2016
Article dans une revue
Communication dans un congrès
2015
Article dans une revue
Poster
2010
Communication dans un congrès
2009
Communication dans un congrès